Severe aortic stenosis is associated with adverse myocardial characteristics like poor myocardial flow reserve
1. Worse myocardial flow reserve (MFR) is associated with severe aortic stenosis (AS); both MFR and aortic stenosis were independently associated with myocardial injury and increased wall stress.
2. MFR is improved in patients that receive aortic valve replacement compared to those who do not receive the treatment, at 6 months post-operation.
Evidence Rating Level: 3 (Average)
Study Rundown: Myocardial flow reserve (MFR) is a measure of how much spare vascular function flows to the heart to manage additional cardiac stress. MFR is impaired in aortic sclerosis and mild aortic stenosis (AS), leading to a higher risk of cardiovascular events. This prospective observational study observed if severe AS was associated with left ventricular structural impairments and other adverse myocardial characteristics like impaired MFR. Additionally, this study investigated whether MFR could be improved by aortic valve replacement (AVR) at 6 months. The myocardial blood flow (MBF) while patients were resting and stress and the MFR were calculated from heart perfusion images. Additionally, serum biomarkers, including PlasmaN-terminal pro–B-type natriuretic peptide (NT-proBNP) and high-sensitivity troponin T (hs-cTnT), were measured. Health status was assessed using Kansas City Cardiomyopathy Questionnaire (KCCQ) and a 6-minute walk test (6MWT). Patients were stratified as mild (mean gradient (MG) <20 mm Hg, aortic valve area (AVA) >1.5 cm2), moderate (MG = 20-40 mmHg, AVA = 1-1.5 cm2), or severe (MG >4 mm Hg, AVA <1 cm2) AS and compared to a matched control group. There was an association where MFR was worse the more severe the AS. MFR and stress MBF were associated with serum biomarkers, but not the health status measures. There was an association of maladaptive heart remodelling like wall thickening with high but not low-stress MBF. In the subset of patients that received AVR, MFR was improved (1.73±0.57 vs 2.11±0.50, P = 0.008). Valve characteristics, stress MBF, and MFR were improved after AVR. The main limitation of this study was its observational nature – its low sample size at a single centre suggests that the conclusions that can be drawn from this study are relatively weaker and purely associative. The conclusions that can be reached about the utility of AVR are also limited due to the relatively short follow-up time of 6 months and selection bias in the candidacy for AVR.
Click to read the study in JAMA Cardiology
Relevant Reading: Myocardial blood flow reserve is impaired in patients with aortic valve calcification and unobstructed epicardial coronary arteries
In-Depth [prospective observational]: Patients with heart conditions other than AS or having any heart hardware were excluded. Stratified AS patients underwent perfusion imaging for rest and stress MBF and MFR calculations, echocardiograms, electrocardiograms, serum biomarkers, the KCCQ, and 6MWT. Some participants underwent AVR, including transcatheter (n = 5) or surgical (n = 4). An age, sex, and heart stress score-matched control group was created without AS for some statistical comparisons. The AS group (n = 34, age = 75.5±9.6, 32% female) and control group (n = 34, 71.41±9.2 years, 32% female) were comparable on demographic information collected, including hypertension. LV remodelling parameters, MFR, and mean global longitudinal strain worsened with increasing AS severity. MFR was associated with GLS (β = −0.31, P = 0.03), LVEF (β = 0.41, P = 0 .002) and LV mass (β = −0.25, P = 0.03). Stress MBF was associated with NT-proBNP (β = −0.37, P = 0.045) and both MFR and stress MBF were associated with hs-cTnT (β = −0.48; P = 0.005). MBF was not associated with health measures like the KCCQ (β = −0.17, P =0 .36) or 6MWT (β = 0.07, P = 0.69). Low-stress, compared to high-stress, MBF commonly featured thicker septum (12.4 mm vs 10.0 mm, P = 0.008), thicker heart wall (0.62 vs 0.46, P = 0.02), and worse GLS (−13.47 vs −17.11; P = 0.006). MFR improved after AVR (1.73±0.57 vs 2.11±0.50, P = 0.008). AVR was associated with improved valve characteristics, stress MBF, and MFR by 0.37±0.21 mL/min/g, −0.05±0.16 mL/min/g, and 0.38±0.33, respectively.
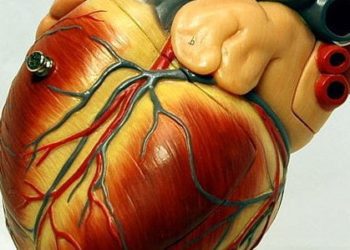
Image: PD
©2021 2 Minute Medicine, Inc. All rights reserved. No works may be reproduced without expressed written consent from 2 Minute Medicine, Inc. Inquire about licensing here. No article should be construed as medical advice and is not intended as such by the authors or by 2 Minute Medicine, Inc.


